Industry Salary Report: China NEV & Intelligent Driving Talent Landscape 2026
China's new energy vehicle (NEV) sector entered a period of accelerated technological divergence and intensified talent competition in 2025-2026. Annual NEV sales surpassed 16 million units in 2025, pushing the penetration rate above 55%. The industry has fully transitioned from policy-driven growth to product-driven competition, and this shift has fundamentally restructured talent demand. Demand for autonomous driving algorithm engineers and EV powertrain (three-electric, or "san-dian") R&D talent is growing 3-5 times faster than demand for traditional vehicle engineering roles. Salary divergence is accelerating in parallel. This report covers 6 core role clusters: autonomous driving algorithms, autonomous driving system integration, EV powertrain (battery/motor/thermal), PACK/BMS, vehicle engineering, and test & validation. Data spans 4 seniority levels (junior, mid, senior, director+) across 6 cities (Shanghai, Beijing, Shenzhen, Suzhou, Hefei, Guangzhou), covering 2025-2026. Compensation figures include base salary, annual bonus, and equity where indicated (P75 and director+ levels include RSU/option value).
Three Core Findings
- Autonomous driving algorithms and BMS engineering form a “dual premium” structure. The median salary for perception algorithm engineers has reached ¥750K. BMS systems engineers follow at ¥550K. Traditional vehicle engineering, by contrast, sits at ¥320K. The gap between algorithm teams and chassis teams at the same company has widened to 2.3x, and it is still expanding.
- Foreign and domestic employers have diverged fundamentally in compensation strategy. Foreign companies (Bosch, ZF, Aptiv) compete on higher base salaries and stable annual increases — base pay is 10-15% above domestic peers at the same level. But when total compensation (including equity) is counted, domestic leaders outpay foreign firms by 20-35%. At the VP/director level, stock option expectations at domestic companies make foreign employers largely uncompetitive for top talent.
- Job-switching premiums are shifting from “blanket inflation” to “precision pricing.” In 2023-2024, any move into autonomous driving guaranteed a 25%+ salary bump. By 2026, premiums have concentrated in 3-5 scarce specializations — BEV perception, end-to-end driving, and automotive AI chips — where jumps of 30-40% remain common. Conventional ADAS calibration and traditional chassis engineering have seen premiums shrink to 10-15%.
Industry Talent Landscape
From “Three-Electric Primacy” to “ADAS-Driven”
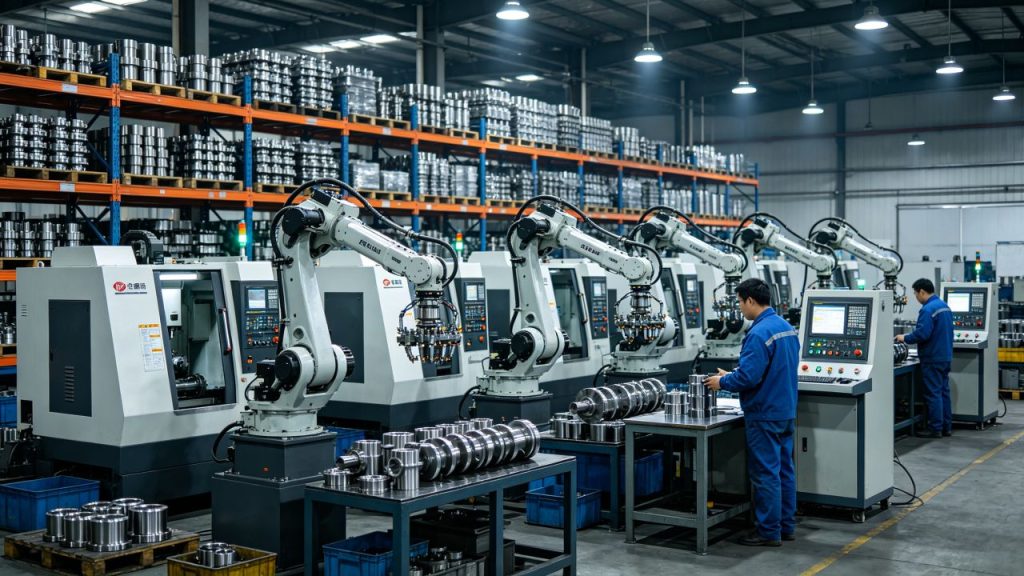
From 2020-2023, the NEV industry’s talent center of gravity was the “three-electric” system: battery, motor, and electronic control. These were the most urgently recruited roles at every OEM. NIO, XPeng, and Li Auto aggressively recruited battery engineers from CATL and Gotion High-tech. A BMS engineer with 3 years of experience could command ¥500K+ annually.
By 2025-2026, this landscape has been rewritten. The commercialization of end-to-end autonomous driving and the mass rollout of city NOA (Navigate on Autopilot) have made ADAS algorithms the new currency in the talent market. BYD expanded its autonomous driving team from 2,000 to 5,000 people in 2025 alone. Huawei’s automotive BU now has over 6,000 people in its ADAS group. Meanwhile, traditional powertrain and chassis hiring has stagnated or contracted.
This structural shift is directly visible in compensation data.
The following table shows 2025-2026 annual salary ranges (P25/P50/P75, in ¥10K/year) by role cluster:
Role Cluster | Typical Roles | P25 (¥10K/yr) | P50 (¥10K/yr) | P75 (¥10K/yr) | YoY Growth |
ADAS Algorithms | Perception/Fusion/Planning/E2E | 45 | 75 | 110 | +22% |
ADAS System Integration | System Arch/Embedded/Middleware | 30 | 52 | 78 | +16% |
EV Powertrain | Battery/Motor/Inverter/Thermal | 28 | 48 | 72 | +12% |
PACK/BMS | Battery Pack/BMS/SOC Algorithm | 25 | 43 | 65 | +15% |
Vehicle Engineering | Chassis/Body/Powertrain/Package | 18 | 32 | 48 | +6% |
Test & Validation | ADAS Test/SIL-HIL/Calibration | 18 | 30 | 45 | +8% |
Sources: Liepin 2025 Automotive Talent Insights, BOSS Zhipin Research Institute 2025 ADAS Talent Trends, CIIC 2025 Key Industry Salary Guide — Automotive Section.
This table makes a stark point: the industry is redistributing compensation along software-defined lines. Algorithm roles command both the highest base and the fastest growth — 22% year-on-year, nearly 4x the rate for vehicle engineering (6%). If this trend persists for another 2-3 years, the compensation gap between these two clusters will stretch from 2.3x to over 3x.
Salary by Seniority: Mid-Level Talent is the Bottleneck, Director-Level Hinges on Equity
Compensation varies significantly by seniority tier. The following table shows median annual salaries by role cluster and level:
Role Cluster | Junior (0-3yr) | Mid (3-6yr) | Senior (6-10yr) | Director+ (10yr+) |
ADAS Algorithms | 300-420K | 480-700K | 720K-1.05M | 1.2-1.8M+ |
EV Powertrain | 200-300K | 320-500K | 520-750K | 850K-1.3M+ |
Vehicle Engineering | 140-200K | 220-350K | 360-500K | 550-800K |
Mid-level (3-6 year) talent is where supply-demand tension is most acute. For ADAS algorithm engineers at this level, job-switching premiums run 30-35%, significantly higher than junior (15-20%) or senior (20-25%) tiers. The reason is a structural bathtub effect: during the 2022-2024 industry contraction, a meaningful number of engineers at this experience level either moved to big-tech AI labs, joined autonomous driving startups that later failed, or left the industry. Now that hiring has recovered, this missing cohort is driving price discovery.
City Comparison: Beijing and Shanghai Lead, Suzhou and Hefei Catch Up
Local government NEV industrial policy has profoundly shaped regional compensation.
City | ADAS P50 (¥10K/yr) | Powertrain P50 (¥10K/yr) | Vehicle Eng. P50 (¥10K/yr) | Key Driver |
Shanghai | 78 | 48 | 32 | Huawei Auto BU, Momenta, NIO global HQ |
Beijing | 80 | 45 | 30 | Baidu Apollo, Pony.ai, Xiaomi Auto |
Shenzhen | 75 | 50 | 33 | BYD global HQ, AutoX, DeepRoute |
Suzhou | 62 | 42 | 28 | Bosch China HQ, Plus.ai, TuSimple |
Hefei | 55 | 40 | 26 | NIO Plant 2, VW Anhui, Gotion High-tech |
Guangzhou | 60 | 40 | 27 | XPeng, GAC Aion, WeRide |
Shanghai’s ADAS algorithm P50 of ¥780K versus Hefei’s ¥550K represents a 42% gap. But Hefei shows a notable trend: powertrain compensation grew the fastest among all six cities (18% year-on-year). The reason is clear: VW Anhui’s full-scale EV production, combined with NIO’s continued expansion in Hefei, has driven powertrain talent demand growth above 30% annually.
Foreign vs. Domestic Employers: Fundamentally Divergent Compensation Strategies
The compensation difference between foreign employers (Bosch, ZF, Aptiv, Tesla China) and domestic companies (BYD, NIO, XPeng, Li Auto, Huawei Auto BU) is the central dynamic driving talent flow in this sector.
Level | Foreign Base | Foreign Total | Domestic Base | Domestic Total | Total Comp Difference |
Junior Algorithm Eng. | 350-450K | 380-480K | 300-400K | 350-500K | Foreign +5-10% |
Mid Algorithm Eng. | 500-650K | 550-720K | 480-650K | 550-850K | Domestic +5-15% |
Senior Algorithm Eng. | 700-900K | 780K-1.0M | 680-900K | 850K-1.2M | Domestic +10-20% |
Algorithm Director/VP | 1.0-1.3M | 1.1-1.45M | 900K-1.3M | 1.4-2.2M+ | Domestic +30-50% |
At the junior level, foreign employers’ higher base pay still appeals to fresh graduates who value stable growth environments and structured training. But at the senior director level, domestic companies have achieved total compensation dominance through stock options and RSUs — a NIO algorithm VP granted stock options in 2025 can expect a four-year-vesting total package of ¥2M+, while the equivalent role at Bosch China caps around ¥1.4M.
Tesla China sits in a middle zone. Its algorithm base salary of ¥550-750K, plus RSUs bringing the total to ¥650-850K, positions it between foreign and domestic peers. But Tesla’s working intensity rivals domestic companies, and two rounds of China team restructuring in 2025-2026 have made stability a key consideration for candidates.

Talent Supply-Demand: The Scarcity Map
Scarce Specialization | S:D Ratio | Jump Premium | Difficulty | Root Cause |
BEV Perception/E2E | 0.3 | 30-40% | 9/10 | Limited global talent pool; academic pipeline cannot keep pace |
BMS Systems Engineer | 0.4 | 25-30% | 8/10 | High-voltage safety + SOC algorithm; long training cycle |
AI Chip/Compute Platform | 0.35 | 25-35% | 9/10 | Cross-domain: automotive chip + AI framework; extremely rare |
System Integration/SIL-HIL | 0.45 | 18-25% | 7/10 | Insufficient talent with full V-model lifecycle experience |
Battery Materials (Solid State) | 0.5 | 20-30% | 8/10 | Solid-state moving from lab to production; few combine research + process |
A supply-demand ratio below 0.5 means on average every 2 open positions compete for fewer than 1 qualified candidate. This level of scarcity directly drives compensation premiums.
Relatively saturated roles include traditional vehicle engineering (chassis/body design, S:D ratio ~1.5) and conventional ADAS calibration engineers (S:D ratio ~1.8). These positions still have demand, but candidate pools are large enough that companies can hire without paying premiums.
Talent Flow Trends: Returning from Foreign to Domestic, Spreading from Tier-1 to Tier-2
Three structural talent flow patterns define 2025-2026.
Domestic companies’ “suction effect” on foreign-enterprise talent continues to strengthen. Approximately 35% of BYD’s director+ hires in 2025 came from foreign Tier-1 suppliers (Bosch, Aptiv, Continental). At NIO and XPeng, the proportion of foreign-enterprise background talent in executive teams now exceeds 30%. The motivation is straightforward: domestic companies offer higher total compensation, greater decision-making autonomy, and faster promotion trajectories.
Tier-2 cities are becoming new talent reservoirs. Hefei, Suzhou, and Changzhou have attracted a significant wave of engineers returning from Tier-1 cities, driven by industrial clustering and favorable policies. A mid-level powertrain engineer earning ¥500K in Shanghai might take ¥380-400K in Hefei — but with housing costs at 35-40% of Shanghai’s, real purchasing power is often higher. This trend has visibly accelerated in 2025-2026.
Foreign employers’ “stability card” still works for junior and mid-level markets. Bosch China proactively adjusted its compensation structure in 2025, raising algorithm role base salaries by 12-15% while strengthening rotation programs and international career paths. For candidates who do not prioritize short-term equity realization, foreign employers’ stability and career development clarity remain significant selling points.

Compensation Trends and Job-Switching Premiums
Annual merit increases averaged 8-12% across the industry in 2025-2026, significantly above the cross-industry average of 5-7%. But this average masks wide variation between role clusters.
Role Direction | Annual Merit | Jump Premium (2024) | Jump Premium (2025-26) | Trend |
ADAS Algorithms | 15-20% | 25-40% | 20-35% | Slight reversion; high-end holds |
EV Powertrain/PACK | 10-15% | 20-30% | 15-25% | Stable |
Vehicle Engineering | 5-8% | 12-18% | 10-15% | Declining toward mechanical industry average |
Test & Validation | 6-10% | 15-20% | 12-18% | Gradual decline |
The shift toward “precision pricing” in job-switching premiums is the defining change of 2026. In 2023-2024, moving into any ADSA sub-field guaranteed a 25%+ bump. By 2026, premiums have concentrated in three directions — BEV perception, end-to-end, and in-vehicle AI chips — where 30-40% remains achievable. Conventional ADAS perception (non-end-to-end approaches) and decision planning (conventional MPDM solutions) have seen premiums fall to 15-20%.
This means companies can no longer rely on “industry-wide inflation” to attract candidates. Differentiated compensation strategies targeting specific scarce specializations are now required.
Practical Implications for HR
This data has direct implications for NEV hiring strategies.
First, algorithm role compensation benchmarks need dynamic adjustment. Using 2024 salary data to set 2026 offers will systematically underestimate the market. The P50 for BEV perception mid-level engineers is growing at 22% annually. Companies should refresh their salary benchmarks semi-annually, not annually.
Second, equity incentives are now standard for director+ talent retention. Domestic companies’ total compensation advantage comes primarily from expected option/RSU appreciation. Foreign employers are structurally disadvantaged here and must compensate through base salary and career development paths — Bosch China’s approach of raising base pay while strengthening international rotation programs is a model worth emulating.
Third, tier-2 city talent strategy must shift from “cost arbitrage” to “value creation.” Hefei powertrain engineer compensation grew 18% — outpacing several tier-1 cities. Companies that merely set up “low-cost R&D centers” in tier-2 cities, offering 60-70% of tier-1 pay, will increasingly struggle to attract and retain core talent. The right approach is to locate core R&D roles in tier-2 cities while offering 80-90% of tier-1 compensation — optimizing both cost and talent acquisition.
Fourth, mid-level talent is the hardest cohort to retain. Algorithm engineers with 3-6 years of experience command the highest job-switching premiums (30-35%) and are less sensitive to long-term equity than director-level talent. For this group, short-term incentives (immediate bonuses, project profit-sharing) are more effective retention tools than long-dated options.
Data Note
This report draws on data from publicly available industry reports including Liepin’s 2025 Automotive Talent Insights, BOSS Zhipin Research Institute’s 2025 ADAS Talent Trends, CIIC’s 2025 Key Industry Salary Guide — Automotive Section, and Maimai’s 2025 Talent Flow and Compensation Report, supplemented by Sun Tzu China’s direct client engagement data from 2025-2026. Compensation figures represent industry range estimates; actual salaries may vary significantly based on company size, individual background, and financing stage. Supply-demand ratios and difficulty indices are industry estimates from third-party research. This document is an industry analysis, not a formal research study, and has not been audited or certified by any third party.